Brief Summary
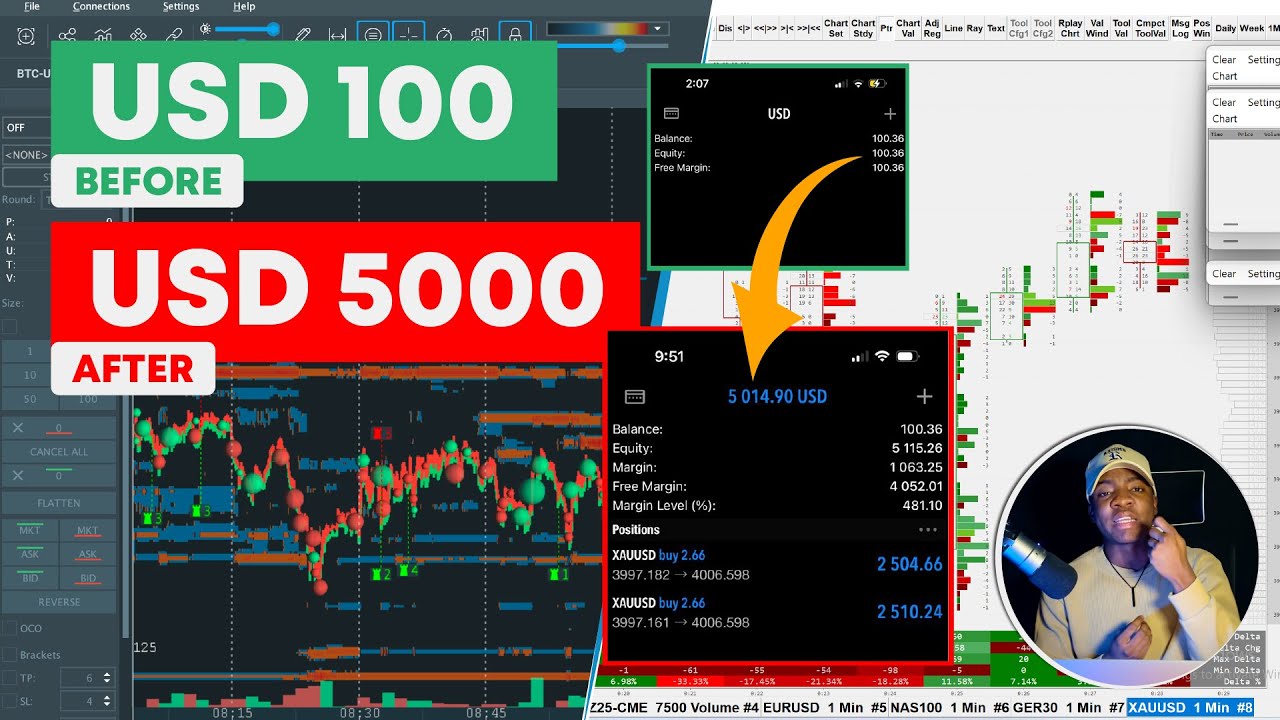
This video explains how a trader turned a $100 account into $5,000 using order flow analysis, heat maps, and footprint charts, without relying on indicators or hope. It details the logic behind three specific trades, emphasizing the importance of identifying liquidity levels, understanding order book dynamics, and using footprint charts for confirmation.
- Identifying liquidity levels is the first step.
- Reacting to the market based on what it's showing, not predicting.
- Using order flow, heat maps, and footprint charts to get sniper entries.
Introduction
The video introduces a strategy to flip a $100 account to $5,000 by using order flow, heat maps, and footprint charts. The trader highlights that the strategy involves no indicators or hope trades, but rather a pure analysis of the order book. The video promises to break down the exact entries, confirmations, and logic behind each move.
Key Concepts: Liquidity Levels and Order Book Heat Map
The first step in this trading strategy is identifying liquidity levels using the order book heat map. These levels represent areas where large limit orders are placed. The trader emphasizes that the market is attracted to liquidity, and these bright horizontal bands on the heat map indicate where smart money wants to transact. Retail traders often see support and resistance, but the trader focuses on resting liquidity that price will move toward.
Trade 1: Identifying Absorption and Delta Flip
The first trade involved waiting for the price to reach a key level identified using the order book heat map. When the price tapped into this level, the trader observed absorption, where sellers tried to push the price down but were rejected. The footprint chart was then used to confirm the entry, specifically looking for a delta flip. A delta flip occurs when the delta is negative, followed by a shift in the next candlestick where buyers dominate, confirming the buy signal.
Trade 2: Confirming Buys with Heat Map and Footprint Chart
The second trade also involved identifying key levels with a liquidity wall using the order book heat map. The trader waited for the price to reach this level and looked for confirmations that buyers were defending it. The footprint chart showed absorption, with a red candlestick having bullish power, indicating a potential buy. A delta flip to the upside further confirmed the buy signal, leading to a successful trade.
Trade 3: Sniper Entry at a Violated Sell Wall
The third trade, which led to the account flip, was a sniper entry at a sell wall that had been violated. Unlike the previous trades, this one involved sell limit orders above the price. When the price hit this wall, buyers aggressively came in, and sellers failed to defend the level. This created a "breaker block," where the price broke through, retested the zone, and then went up. The trader waited for confirmation, observing consolidation and absorption, followed by green bubbles indicating large buy transactions. The footprint chart confirmed absorption with a red candle showing buyers, leading to a successful buy entry.
Key Steps and Conclusion
The key steps include identifying liquidity levels, waiting for the price to reach those levels, and reacting to the market by reading the order book and footprint chart for confirmations. The trader emphasizes that understanding liquidity and order flow provides an "X-ray vision" of the market, leading to higher win rates and confidence. By using these tools, one can avoid guessing and make informed decisions based on real market activity, turning a small deposit into a significant profit.

