Brief Summary
This video provides a detailed analysis of the stock market, focusing on the S&P 500, NASDAQ, and Russell 2000 indices. The author discusses the recent market volatility, the impact of the Federal Reserve's interest rate decisions, and the potential for a market downturn. He also highlights the importance of using multiple time frame analysis and proprietary indicators to make informed trading decisions.
- The author believes that the recent market decline was driven by overvaluation and a weakening in the small and mid-cap sectors.
- He expects a rally into January but believes it will fall short of the previous highs, making it a potential selling opportunity.
- The author warns of a potential downturn in the stock market based on the performance of high-yield bonds, which he sees as a negative signal.
Market Analysis and Projections
The video begins with a discussion of the recent market volatility, which the author attributes to a combination of factors, including overvaluation, the Federal Reserve's interest rate decisions, and a weakening in the small and mid-cap sectors. He notes that the market experienced a significant decline in the past week, with the Dow Jones Industrial Average falling for 11 or 12 consecutive days. However, the market rebounded today, with the S&P 500 gaining over 170 points. The author believes that this rebound is likely to be short-lived and that the market is poised for further decline.
S&P 500 Analysis
The author analyzes the S&P 500 using multiple time frame charts, including weekly, daily, and two-hour charts. He highlights the importance of using momentum indicators to identify potential reversals and support/resistance levels. He believes that the recent rally in the S&P 500 is likely to fail in the area between 595 and 598.30 on the SPY ETF, which he identifies as a sell zone. He also notes that the market condition indicator is turning down, suggesting that the market is moving into negative territory.
NASDAQ Analysis
The author analyzes the NASDAQ, noting that it has a better chance of moving to a new high in January than the S&P 500. However, he cautions that the NASDAQ is still showing signs of weakness, particularly in the mega-cap stocks. He believes that the NASDAQ will need to overcome the previous high to confirm a new bull market peak.
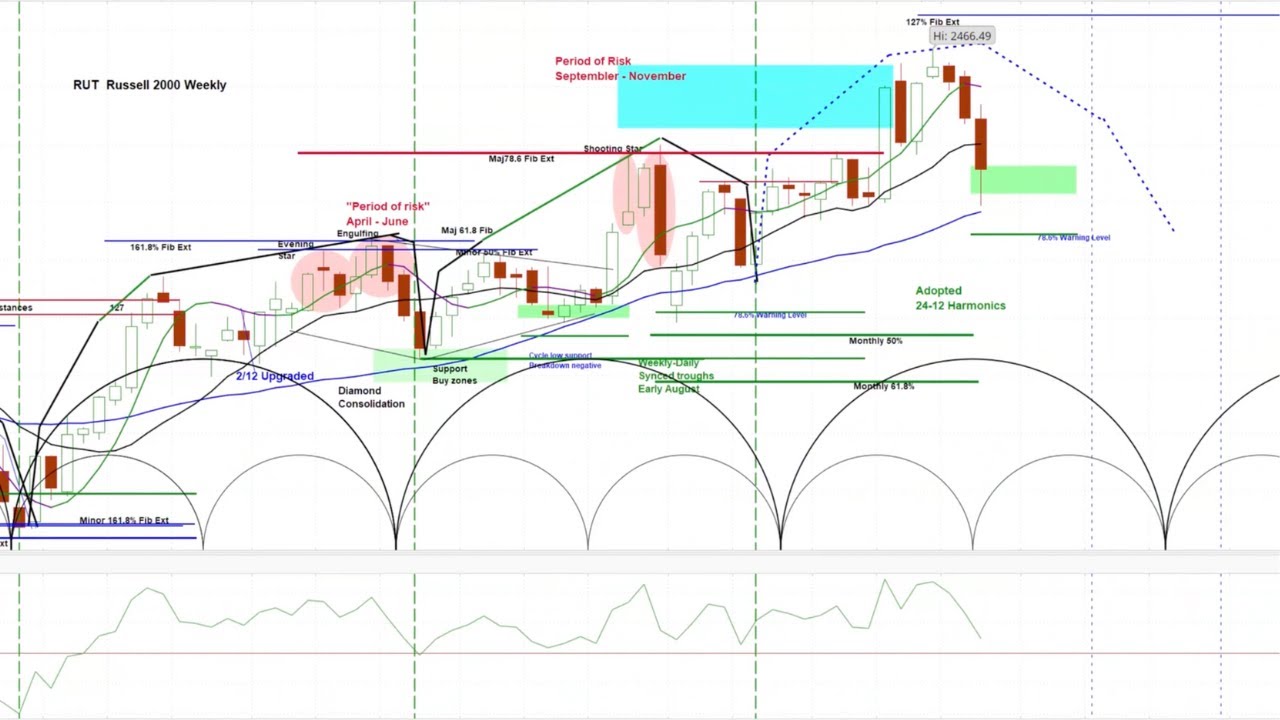
Russell 2000 Analysis
The author analyzes the Russell 2000, which he believes is in a downtrend. He points to a breakdown in the weekly chart and a negative momentum indicator as evidence of this downtrend. He projects that the Russell 2000 will continue to decline into March.
Mid-Cap Analysis
The author analyzes the mid-cap sector, represented by the MDY ETF. He notes that the mid-cap sector has broken below a key support level, indicating a potential downtrend. He believes that any rally in the mid-cap sector is likely to be short-lived.
High-Yield Bond Analysis
The author analyzes the relationship between the S&P 500 and high-yield bonds, represented by the HYG ETF. He notes that the two markets have historically tracked each other closely. However, he observes a recent breakdown in the high-yield bond market, which he sees as a very negative signal for the stock market. He believes that this breakdown suggests a potential downturn in the stock market that could extend into May.
Bias Heat Map
The author introduces his bias heat map, a tool that uses proprietary indicators to assess the strength and weakness of different sectors and stocks. He explains how to use the heat map to identify potential trading opportunities, focusing on the short-term reversals and long-term swing trades. He highlights the importance of using the heat map in conjunction with other technical analysis tools.

