Brief Summary
This lecture introduces the mathematical foundations of machine learning, focusing on unsupervised learning and representation learning. It emphasizes the concept of "comprehension as compression," where understanding data involves compressing it to retain only essential information. The lecture explores how to represent data points in a compressed form using representatives and coefficients, and addresses the challenge of handling data points that do not fit neatly into a single representative model by using projection to find the closest proxy.
- Unsupervised learning aims to understand useful information from a set of data points without supervision.
- The principle of "comprehension as compression" guides the approach to learning and algorithm design.
- Data compression can be achieved by representing data points using a representative vector and coefficients.
- When data points do not align, projection can be used to find the closest proxy for compression.
Introduction to Unsupervised Learning
The course will cover various machine learning techniques, including unsupervised and supervised learning. The initial focus is on unsupervised learning, specifically representation learning. The goal of unsupervised learning is to extract useful information from a given set of data points. This involves defining what constitutes a data point, understanding what it means to "understand" the data, and determining what makes the understanding "useful". Data points are treated as vectors in a D-dimensional space, with each dimension representing a feature.
Comprehension as Compression
The lecture introduces a guiding principle: "Comprehension is compression," attributed to George Chaitin. This means that understanding or learning from data involves the ability to compress it, retaining only the essential information. This theme will be used throughout the course to evaluate algorithms, asking where the compression occurs and how it provides insights into the algorithm's design and behavior.
Problem Formulation: Input and Output
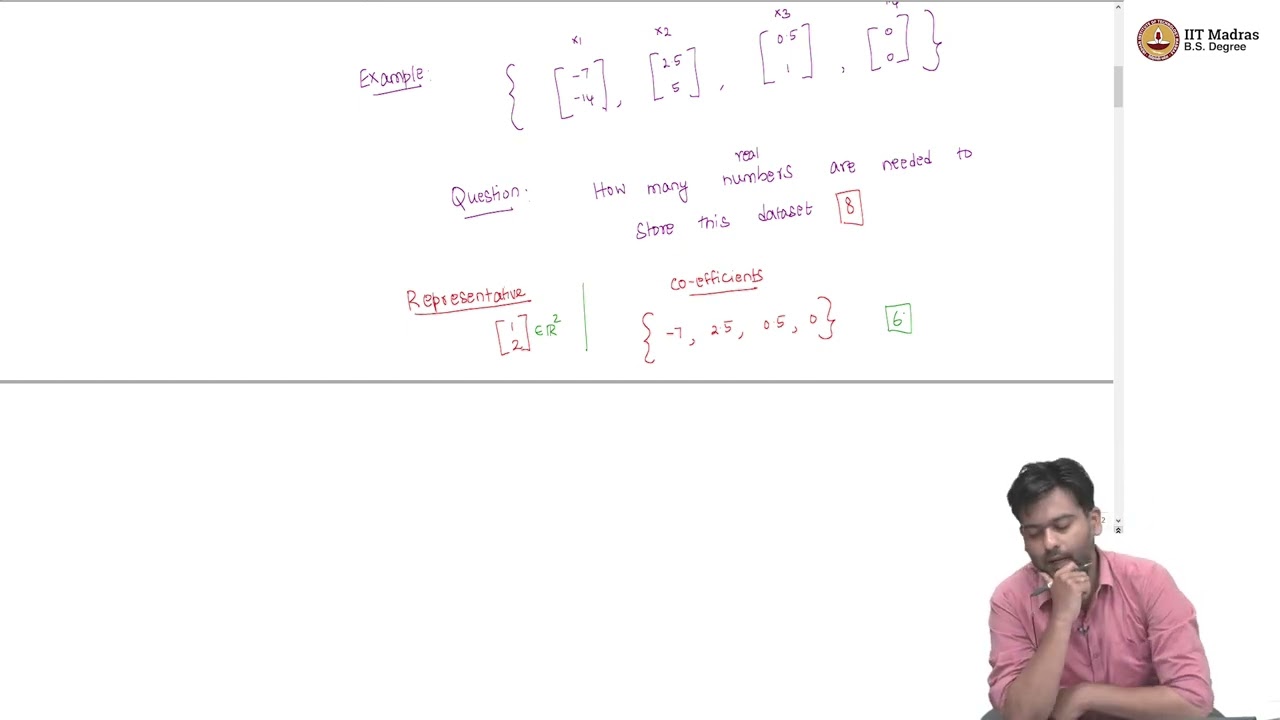
The problem is defined with an input of n data points, each represented as a vector in Rd, where d is the number of features. The desired output is a compressed representation of this data set. The lecture uses an example with four 2D data points to illustrate how data can be compressed by identifying relationships between features.
Data Compression with Representatives and Coefficients
The lecture explores compressing data by storing a representative point and coefficients for each data point. In the example, the relationship between the coordinates allows representing the data using a single representative vector (1, 2) and a coefficient for each point. This reduces the storage requirement from eight numbers to six. This method allows for exact reconstruction of the original data set by multiplying the representative by the corresponding coefficient.
Geometric Interpretation and Flexibility of Representatives
Geometrically, the data points lie along a line, and any vector along this line (except the origin) can serve as a representative. The choice of representative is flexible, as long as the coefficients are adjusted accordingly to allow for exact reconstruction. The key is that the compressed representation requires fewer numbers than the original data, achieving compression.
Limitations of Single Representative and Introduction to Proxies
The lecture addresses the scenario where data points do not all lie on the same line, making it impossible to represent them with a single representative and achieve exact reconstruction. In such cases, one approach is to use multiple representatives, but this can increase the number of coefficients needed, negating the compression benefit. To overcome this, the lecture suggests giving up the requirement of exact reconstruction and instead finding a proxy point on the line for the outlier data point.
Finding the Best Proxy: Projection
The best proxy for a data point not on the line is the point on the line that minimizes the distance to the original point. This is achieved through projection. The lecture poses the question of who can pretend to be a proxy for a point along a line, answering that the projection of the point onto the line serves as the best proxy.
Mathematical Formulation of Projection
The lecture formulates the projection problem mathematically. Given a line represented by a vector (W1, W2) and a point (X1, X2), the goal is to find the constant c such that the point c(W1, W2) on the line is closest to (X1, X2). This involves minimizing the length of the error vector, which leads to an optimization problem. The solution involves finding the optimal value of c, denoted as c*, which depends on the dot product of X and W, and the squared length of W.
Simplifying Projection with Unit Vectors
The expression for c* is simplified by choosing a representative vector W with a length of 1 (a unit vector). This simplifies the calculation of c* to just the dot product of X and W, making the projection calculation more straightforward.
Summary of Data Representation and Compression
The lecture summarizes the approach to data representation and compression. If data points lie along a line, a representative and coefficients can be used. If a point does not lie on the line, it can be projected onto the line to find a proxy. The location of this proxy point along the line is given by X transpose W multiplied by the vector W.

