Brief Summary
This video explains the difference between statistics and parameters, using examples and symbols to illustrate the concepts. It highlights that statistics describe characteristics of a sample, while parameters describe characteristics of a population. The video also includes a quiz to test understanding of these concepts.
- Statistics describe a sample.
- Parameters describe a population.
- Key symbols differentiate sample and population characteristics.
Introduction to Statistics and Parameters
Statistics are characteristics that describe a sample, which is a subset of a larger population. Parameters, on the other hand, are characteristics that describe the entire population. For example, if you want to estimate the average age of 100,000 residents in a town, taking the average age of 100 individuals would give you a sample mean (a statistic). The true average age of all 100,000 residents would be the population mean (a parameter).
Variables and Symbols
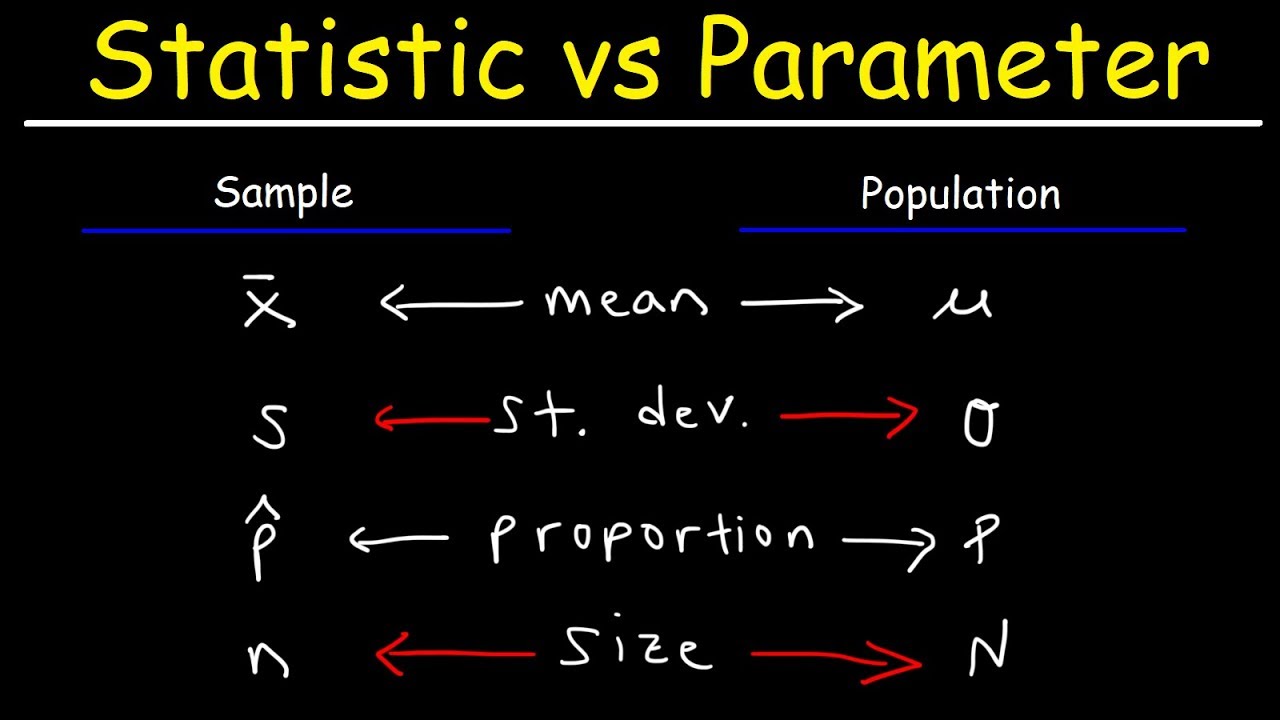
Different symbols represent statistics and parameters. The sample mean is represented by x̄, while the population mean is represented by μ (mu). The sample standard deviation is represented by s, and the population standard deviation is represented by σ (sigma). The sample variance is s², while the population variance is σ². The sample proportion is P̂ (P-hat), and the population proportion is P. The sample size is represented by lowercase n, and the population size is represented by uppercase N.
Quiz: Identifying Statistics and Parameters
A quiz helps differentiate between statistics and parameters. The average weight of all males in the United States is a parameter because it describes the entire population. The average height of 100 cats in California is a statistic because it describes a sample. Similarly, the average test score of 20 students in a class of 500 is a statistic, while the average test score of all students in the class is a parameter.

