Brief Summary
This video explains the stress versus strain curve for tensile materials. It defines stress and strain, explains Hooke's law, and describes the different regions of the curve, including the elastic region, plastic region, yield strength, ultimate tensile strength, and breaking point. The video also touches on the differences in stress-strain curves for different materials.
- Stress is the resistance developed inside a body due to an applied force.
- Strain is the ratio of change in length to the original length.
- The stress-strain curve illustrates the behavior of a material under tensile load, showing elastic and plastic regions, yield strength, ultimate tensile strength, and breaking point.
Introduction to Stress and Strain
The video introduces the concepts of stress and strain, fundamental to understanding material behavior under load. Stress is defined as the force acting on a body divided by the area over which it acts, representing the internal resistance to deformation. Strain, on the other hand, is the ratio of the change in length to the original length when a force is applied. The video uses the example of a spring to illustrate how force causes elongation and, consequently, strain.
Understanding the Stress-Strain Curve
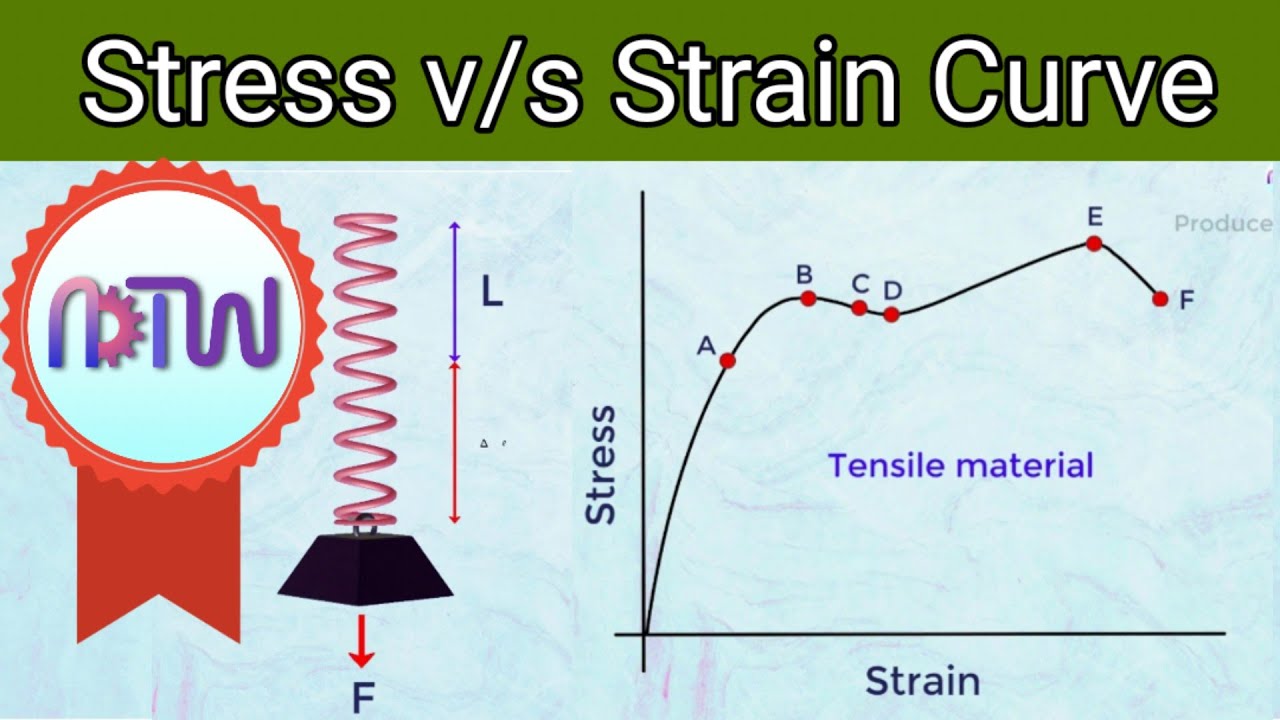
The video explains the stress versus strain curve for a tensile material, plotting stress on the y-axis and strain on the x-axis. As stress is applied to a material, it undergoes strain, and these values are plotted on the graph. Initially, the material behaves elastically, meaning it returns to its original shape when the stress is removed. This linear portion of the curve is known as the proportionality region, where Hooke's Law applies.
Elastic Region and Hooke's Law
The video details the initial elastic region of the stress-strain curve, highlighting the proportionality point where Hooke's Law is valid. Hooke's Law states that stress is directly proportional to strain, with Young's modulus (E) as the proportionality constant. In this elastic region, the material returns to its original shape upon removal of the applied stress.
Elastic Limit and Yield Strength
Beyond the proportionality point, the video describes the non-linear elastic region, extending to the elastic limit (point B). The stress at this point is termed the yield strength (Sy). Up to the elastic limit, the material still returns to its original shape when the stress is removed, but the relationship between stress and strain is no longer linear.
Plastic Region and Permanent Deformation
The video explains what happens when the stress is further increased beyond the elastic limit, leading the material into the plastic region. In this region, even a small change in stress results in a significant increase in strain. If the load is removed within this region, the material will not return to its original shape, resulting in permanent deformation.
Yield Point, Ultimate Tensile Strength, and Breaking Point
The video describes key points on the stress-strain curve beyond the plastic region. Point E represents the yield point, with its corresponding stress known as the ultimate tensile strength (Su). Beyond this point, the material experiences additional strain even with reduced stress, eventually leading to fracture at the breaking point (F). The video also mentions the lower yield point (D), characterized by lower stress but high strain.
Material Variations and Conclusion
The video concludes by noting that the stress-strain curve varies depending on the material. Brittle materials, for example, have yield, ultimate strength, and breaking points that are very close together.

