Brief Summary
This video provides a comprehensive guide to understanding and trading candlestick patterns in financial markets. It covers the basics of reading candlestick charts, analyzing candle strength and momentum, classifying different patterns, and applying specific trading strategies for both reversal and continuation patterns. The course also discusses the significance of Doji and spinning top candles as indicators of market indecision.
- Basics of reading candlestick charts
- Analysis of candle strength and momentum
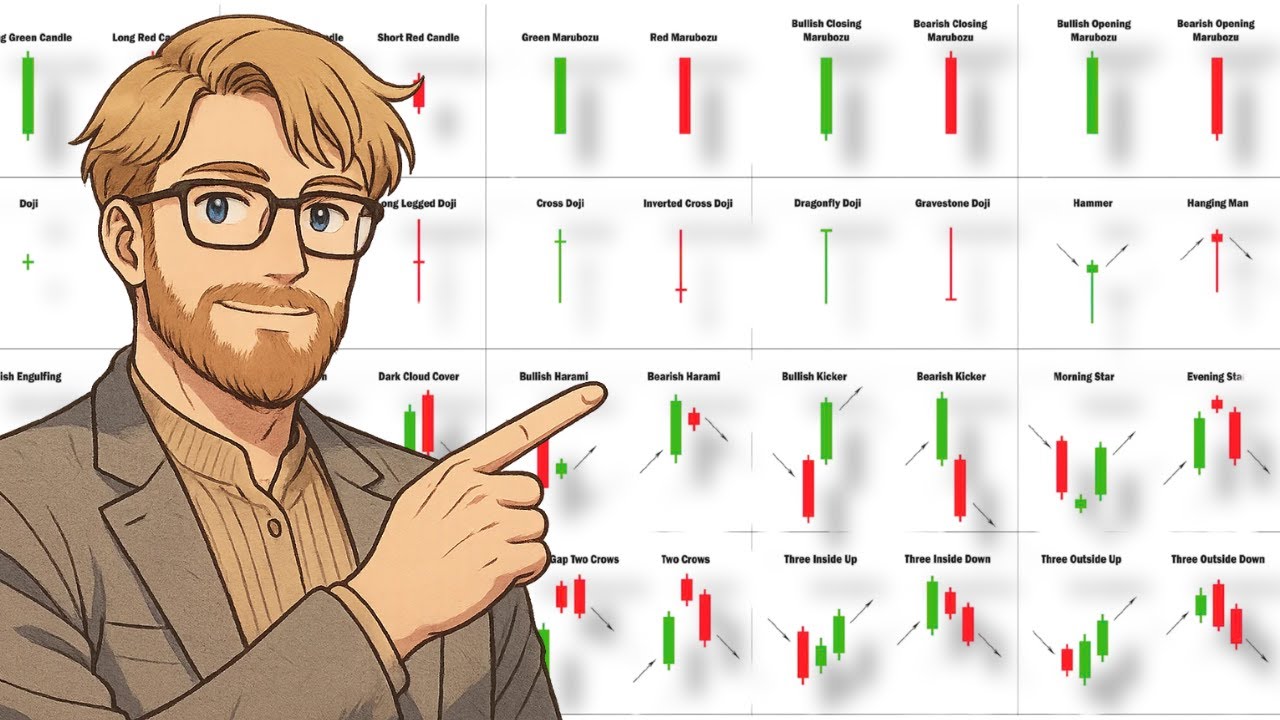
- Classification of candlestick patterns
- Trading strategies for reversal and continuation patterns
- Significance of Doji and spinning top candles
Intro
The video introduces a comprehensive candlestick pattern trading course designed to equip viewers with the knowledge and skills to trade candlestick patterns effectively across various financial markets, including stocks, Forex, and crypto. The course aims to provide an edge in both bullish and bearish market conditions.
What you will Learn in this Course
The course will cover how to read and understand candlesticks and candlestick patterns, including basics, strength, and momentum. It also includes candlestick pattern classifications based on complexity, direction, and type. The course will teach reversal candlestick patterns and their trading strategies, as well as continuation candlestick patterns with corresponding strategies. Finally, the course will discuss Doji and spinning top candles, explaining their significance and how to utilize them in trading.
How to Read Candlestick Charts (step-by-step)
Candlestick charts are composed of red (bearish) and green (bullish) candles, representing price decreases and increases, respectively. Each candle represents a specific time period, known as a time frame, which can range from one minute to one day. Each candle has four key points: the high, open, close, and low (OHLC). The "wick" or "shadow" indicates the highest and lowest prices reached during the time frame, while the "body" represents the range between the opening and closing prices.
Bullish and Bearish Candle Strength
Candle strength is determined by the body of the candle. A candle that opens lower and pushes to a higher point indicates a strong upward movement. Even if a candle appears bearish, it doesn't mean the price fell in a straight line; it could have trended downwards. Candles with small bodies and long wicks indicate indecision, where neither bulls nor bears are in control, and are known as "Doji" candles.
Candlestick Wick Analysis
Candlestick wick analysis involves examining the length and position of wicks to gain insights into price movements. A candle with a longer lower wick indicates stronger bullish sentiment because it shows a greater price reversal from the low to the close. Conversely, a candle with a longer upper wick suggests stronger bearish sentiment, as the price moved higher but was then pushed down. These differences can be particularly important when analyzing price action around support and resistance levels.
The Power of Candlestick Momentum
Candlestick momentum refers to the speed or velocity of price movement, relative to previous candles. Decreasing momentum is indicated by successively smaller real bodies and longer wicks, signaling uncertainty. A "momentum candle" is defined as a candlestick with a real body at least twice the size of the previous candles, indicating a strong signal.
Classification of Candlestick Patterns (Complexity, Direction, and Type)
Candlestick patterns are classified by complexity (simple or complex), direction (bullish, bearish, or neutral), and type (reversal or continuation). Simple patterns consist of one candle, while complex patterns involve two or more. Bullish patterns suggest an upward price movement, bearish patterns indicate a downward movement, and neutral patterns imply uncertainty. Reversal patterns signal a change in trend direction, whereas continuation patterns suggest the current trend will persist.
Best Reversal Candlestick Patterns
Reversal patterns indicate a trend shift and can be simple or complex. The context of where these patterns appear on the chart is crucial.
The Bullish Engulfing Pattern
The bullish engulfing pattern is a complex, bullish reversal pattern that occurs after a downtrend. It consists of a small red candle followed by a larger green candle that opens below the close of the red candle and closes above the open of the red candle, effectively "engulfing" it.
Bullish Engulfing Trading Strategy
To trade the bullish engulfing pattern, enter at the close of the green candle. Place the stop-loss just below the lowest point of the pattern, considering previous market structure for additional support. Use a risk-to-reward ratio to determine the profit target.
The Bearish Engulfing Pattern
The bearish engulfing pattern is a complex, bearish reversal pattern that appears after an uptrend. It features a small green candle followed by a red candle that opens above the green candle's body and closes below it, engulfing the previous candle.
Bearish Engulfing Trading Strategy
To trade the bearish engulfing pattern, enter at the close of the red candle. Set the stop-loss above the highest point of the pattern, allowing for some wiggle room. Use a risk-reward ratio to determine the target level. The pattern is more significant when it occurs at a resistance level.
The Hammer Pattern
The hammer pattern is a simple, bullish reversal pattern that consists of a single candlestick with a small real body and a long lower wick, which should be at least twice the size of the real body. It appears after a downtrend and indicates a potential reversal to the upside.
Hammer Pattern Trading Strategy
To trade the hammer pattern, enter at the close of the hammer candle. Place the stop-loss below a support area, allowing for some wiggle room. Use a 2:1 risk-to-reward ratio to set the target level, or consider using support and resistance levels to adjust the target.
The Shooting Star Pattern
The shooting star pattern is a simple, bearish reversal pattern consisting of a single candlestick with a small real body and a long upper wick, which should be at least twice the size of the real body. It appears after an uptrend and signals a potential reversal to the downside.
Shooting Star Trading Strategy
To trade the shooting star pattern, enter at the close of the candle. Place the stop-loss slightly above a resistance level, allowing for some wiggle room. Use a 2:1 risk-to-reward ratio to determine the target level.
The Morning Star Pattern
The Morning Star is a complex, bullish reversal pattern consisting of three candlesticks. The first is a strong red candle, followed by a small-bodied candle (either green or red) that gaps down from the first. The third candle is a strong green candle that gaps up from the second and closes well within the body of the first red candle.
Morning Star Trading Strategy
To trade the Morning Star pattern, enter at the close of the third, green candle. Place the stop-loss below the lowest point of the pattern. Use a 2:1 risk-to-reward ratio to set the target, or use previous market structure, such as resistance levels, to determine the target.
The Evening Star Pattern
The Evening Star is a complex, bearish reversal pattern made up of three candlesticks. It starts with a strong green candle, followed by a small-bodied candle (either green or red) that gaps up from the first. The third candle is a strong red candle that gaps down from the second and closes well into the body of the first green candle.
Evening Star Trading Strategy
To trade the Evening Star pattern, enter at the close of the third, red candle. Place the stop-loss above the highest point of the pattern. Use a risk-to-reward ratio, such as 2:1 or 3:1, to determine the target level.
The Piercing Pattern
The piercing pattern is a complex, bullish reversal pattern consisting of two candlesticks. The first is a red candle, followed by a green candle that opens lower than the previous close but closes above the midpoint of the red candle's body.
Piercing Pattern Trading Strategy
To trade the piercing pattern, enter at the close of the green candle. Place the stop-loss below the lowest point of the pattern, allowing for some wiggle room. Use a risk-reward ratio of 2 to determine the target.
The Dark Cloud Cover Pattern
The dark cloud cover is a complex, bearish reversal pattern consisting of two candlesticks. The first is a strong green candle, followed by a red candle that opens above the previous close but closes below the midpoint of the green candle's body.
Dark Cloud Cover Trading Strategy
To trade the dark cloud cover pattern, enter at the close of the red candle. There are two options for placing the stop-loss: either above the highest point of the pattern or just above the candle close of the pattern. Use a risk-reward ratio to determine the target level, adjusting the target based on the chosen stop-loss.
The Inverted Hammer Pattern
The inverted hammer pattern is a simple, bullish reversal pattern consisting of a single candlestick with a small real body and a long upper wick. It appears after a downtrend and suggests a potential reversal to the upside.
Inverted Hammer Trading Strategy
To trade the inverted hammer pattern, there are two potential entry points: at the close of the inverted hammer candle or after a confirmation candle. Place the stop-loss below the lowest point of the candle before the inverted hammer. Use a risk-reward ratio to determine the target level.
The Hanging Man Pattern
The hanging man pattern is a simple, bearish reversal pattern consisting of a single candlestick with a small real body and a long lower wick. It appears after an uptrend and signals a potential reversal to the downside.
Hanging Man Trading Strategy
To trade the hanging man pattern, enter at the close of the hanging man candle or wait for a confirmation candle. Place the stop-loss just above a resistance level. Use a risk-reward ratio to determine the target level.
Best Continuation Candlestick Patterns
Continuation patterns indicate that the current trend will continue. The location on the chart, or the context of the patterns, is very important.
The Rising Three Methods Pattern
The rising three methods pattern is a complex, bullish continuation pattern consisting of five candlesticks. It begins with a strong bullish candle, followed by three small bearish candles, and concludes with another strong bullish candle that closes above the close of the first candle.
Rising Three Methods Trading Strategy
To trade the rising three methods pattern, enter at the candle close of the last candle. Place the stop loss below the lowest point of the whole pattern. To get your target level, use a fixed risk reward or a measured move.
The Falling Three Methods Pattern
The falling three methods pattern is a complex, bearish continuation pattern consisting of five candlesticks. It starts with a large red candle, followed by three small candles that go in the opposite direction, and ends with another strong bearish candle.
Falling Three Methods Trading Strategy
To trade the falling three methods pattern, enter at the close of the fifth candle. Place your stop loss above the highest point. For your target level, keep it simple with a risk reward ratio.
The Bullish Momentum Candle
The bullish momentum pattern is a simple pattern where the actual pattern is only one candlestick. Before this pattern, we preferably want to see an uptrend.
Bullish Momentum Trading Strategy
To trade the bullish momentum, enter at the candle close of the momentum candle. For your stop-loss level, it's very important to consider the market structure.
The Bearish Momentum Candle
The bearish momentum pattern is a simple pattern because it consists of only one candlestick. Before the pattern appears, we preferably want to see a move towards the downside.
Bearish Momentum Trading Strategy
To trade the bearish momentum, the most straightforward entry point is where the momentum candle closes. For your stop-loss, we have a few different options.
The Bull Flag Pattern
The bull flag pattern is a complex pattern. Before the pattern appears, we need to see an uptrend.
Bull Flag Trading Strategy
To trade the bull flag, the most common entry point is to simply enter at the candle close of the green candle. The stop-loss is usually set below the lowest point of the flag.
The Bear Flag Pattern
The bar flag is a complex pattern. Before the pattern appears, we want to see a downtrend.
Bear Flag Trading Strategy
To trade the bare flag, the most common way to enter is to enter at the candle close of the last Red candle. For your stop-loss, you usually want to place it above the highest point of the pattern.
The Bullish Runaway Gap
The bullish runaway Gap pattern is a simple pattern. Before the pattern appears, we want to see an uptrend.
Bullish Gap Trading Strategy
To trade the bullish runaway Gap, the most common entry point is to enter here at the open after the Gap. For your stop-loss, you usually want to place the stop loss here below the lowest point of the Gap.
The Bearish Runaway Gap
The bearish runaway Gap is a simple pattern. To identify the pattern, we need to first see a downtrend.
Bearish Gap Trading Strategy
To trade The bearish Runaway Gap, the most common way to enter is to enter already at the open of the first candle after the gap. For the stop loss, we usually place the stop loss just slightly above the highest point of the Gap.
Doji and Spinning Top Candles
Doji and spinning top candles are part of a specific group that we call indecision candles. Indecision candles indicate uncertainty in the market and they can signal potential shifts in the sentiment.
Doji Candles (Classic, Long-Legged, Dragonfly, Gravestone, Four Price)
The most important part about the DOI candle is that the body is pretty much only a line which means that the candles open during the candle it moves up and down but the candle closes pretty much at the exact same level where it opened. Depending on where the real body is located the doy candles can actually be either bullish or bearish.
Doji Candle Trading Strategy
On this particular chart you can see that we have a downtrend because we printed consecutive lower highs and we also printed lower lows and you can see that after this massive bearish this was a bearish momentum candle appeared you can actually see that we saw multiple multiple DOI candles emerging.
Spinning Top Candles
The spinning top candle is very similar to the dogee but the difference here is that for the spinning top candle we allow for larger real bodies. They give us a similar meaning as the doy candle or in other words they indicate indecision in the market that neither the Bulls or the bars are in control.

