
Brief Summary
This video explains the correlation coefficient, a statistical measure that indicates the strength and direction of the relationship between two variables. The correlation coefficient ranges from -1 to 1, where 1 signifies a perfect positive correlation, -1 indicates a perfect inverse correlation, and 0 denotes no correlation. The Pearson correlation coefficient is discussed as a common method for measuring correlation, defined mathematically using covariance and standard deviation.
Understanding the Correlation Coefficient
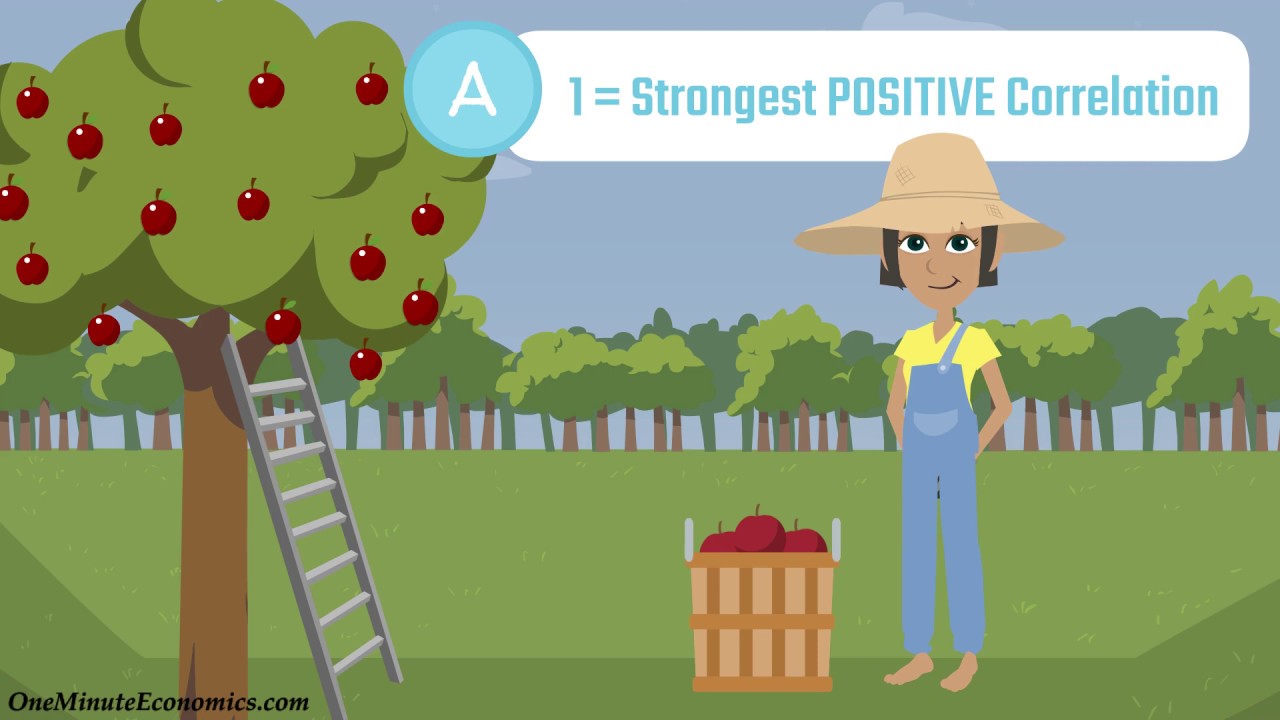
The correlation coefficient is introduced as a measure that shows not just the direction of relationships between variables (similar to covariance) but also their strength. Values range from -1 to 1: a value of 1 indicates a perfect positive correlation, such as earning $2 for every apple picked, while -1 signifies a perfect negative correlation, where picking apples reduces the money available to pay. A value of 0 means there's no relationship at all. The video highlights the Pearson correlation coefficient (R) as the most recognized version, calculated by dividing the covariance of two variables by the product of their standard deviations. The formula is simplified to emphasize that R equals covariance divided by the standard deviations of both variables.