Brief Summary
This video provides a comprehensive guide to chart patterns for trading in various financial markets. It covers pattern identification, classification (bullish/bearish, reversal/continuation), and trading strategies, including entry and exit points, stop-loss placement, and target setting. The course emphasizes understanding the logic and psychology behind each pattern and highlights both the advantages and limitations of using chart patterns in trading.
- Covers basics of chart patterns and advanced trading strategies.
- Explains pattern identification, classification, and trading strategies.
- Highlights advantages and limitations of chart patterns.
Intro
The video introduces a free course on chart patterns for trading stocks, cryptocurrencies, Forex, and other financial markets. It aims to be the best chart patterns course on YouTube, covering both basic and advanced topics. The course is designed for both beginners and experienced traders, teaching how to identify chart patterns, understand their classifications, and use advanced trading strategies. Chart patterns are universal and appear on all time frames, making this course suitable for day traders, scalpers, and swing traders. The goal is to help viewers become consistently profitable by dedicating time and effort to learning and practicing the material.
Important Info, Tips & Tricks
For beginners, it's recommended to watch the chapters in order due to the step-by-step structure of the course. More advanced traders can use the timestamps or video chapters to skip or replay certain parts. Taking notes, whether on paper or digitally, is encouraged to enhance understanding and improve retention. Replaying unclear parts of the video is a key benefit of educational videos. Doing the exercises provided during the course is recommended to practice and improve trading skills. Viewers are encouraged to ask questions in the comments section for clarification.
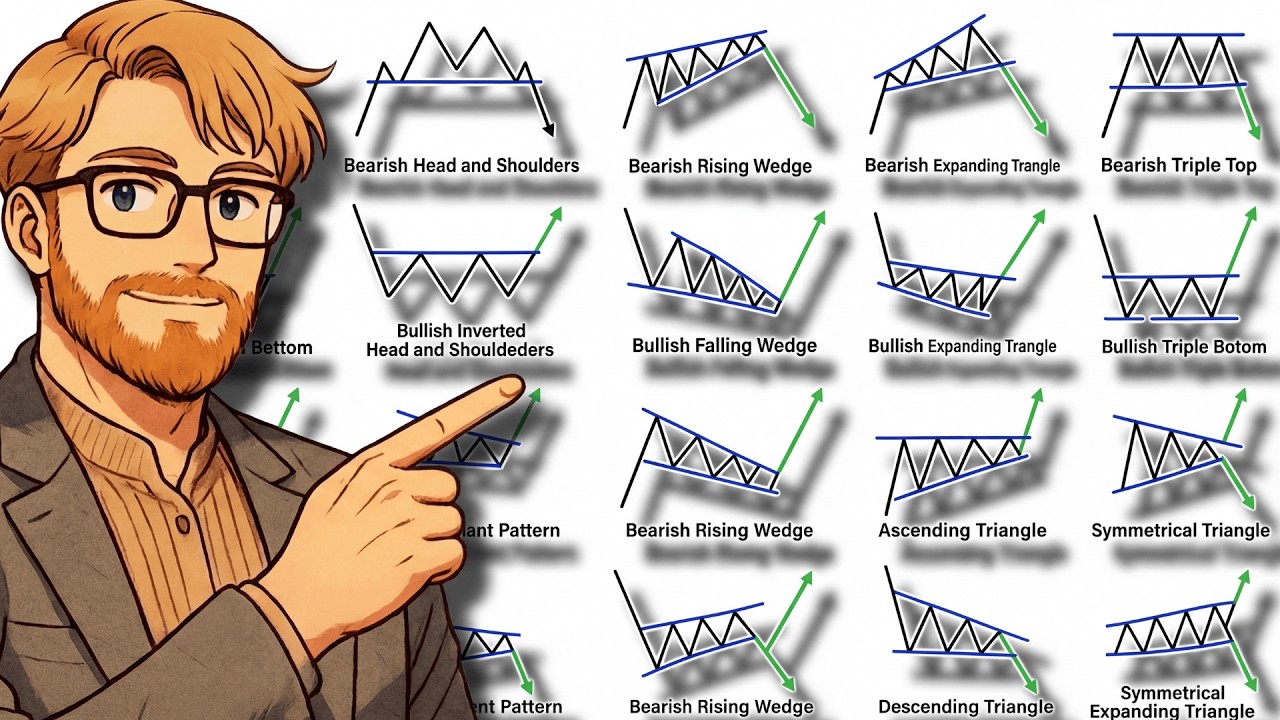
Chart Pattern Classifications
Every chart pattern has a direction (bullish or bearish) and a type (reversal or continuation). A bullish direction indicates the price will go up, while a bearish direction indicates the price will go down. A reversal pattern indicates a change in the price direction compared to before the pattern, while a continuation pattern indicates the price will continue in the same direction. There are bullish and bearish reversals, as well as bullish and bearish continuations. Uncertain patterns lack a clear direction or type and are generally avoided due to their difficulty in trading. Recognizing when not to trade is as important as spotting trading opportunities.
The Double Bottom Pattern
The double bottom pattern is a bullish reversal pattern that appears after a downtrend. To identify it, look for two lows at around the same level. Draw a horizontal line connecting these lows and another connecting the high between the two low points. The first move down after the pattern is significant.
Double Bottom Strategy
The most common entry point is on the candle that breaks above the line defined by the high between the two low points. Place the stop loss just below the lowest point of the double bottom. Target a risk-to-reward ratio of 1:2 or more. Another strategy is to enter at the candle that slightly dips below the low created by the first bounce, with the stop loss just below the lowest point of that candle. A quick strategy aims for quick profits. Another potential entry is on the pullback after the price breaks the high between the lows. The psychology behind the double bottom is that breaking the high terminates the downtrend, creating a buying opportunity.
The Double Top Pattern
The double top pattern is a bearish reversal pattern, where the price is pushing higher but finds two tops at around the same level. Draw a line between the two highs and another at the lowest low between the highs. In real markets, the price may push slightly above the high before reversing.
Double Top Strategy
An excellent entry point is to wait for the price to pull back after breaking below the low between the highs and then enter at the pullback. Place the stop loss above the highest point of the pullback. Target a 2:1 risk-reward ratio. It's common for the price to push above the middle line before reversing, so focus on confirming the entry with a small move towards the downside. Strategies from the double bottom pattern can also be applied to the double top.
The Bull Flag Pattern
The bull flag pattern is a continuation pattern that appears frequently in the market. It is relatively simple to identify. Look for a strong impulsive move (move in the same direction as the trend) followed by a pullback (move in the opposite direction). The bull flag may print minor lower highs and lower lows within the move.
Bull Flag Strategy
To find a good bull flag, the move before the flag should be sharp, with strong candles. During the flag, prefer small candles, indicating a tight consolidation. The most common entry is on the candle that breaks above the flag, with a strong candle. Place the stop loss below the lowest point of the flag. Use a risk-reward ratio of two, or measure the impulsive move up and use that distance as the target. Another entry is at the support of the flag, looking for a candle that quickly dips below the support and then pushes above (a false breakout or failure test). Not all bull flags will have clear highs and lows; some may be simple pullbacks.
The Bear Flag Pattern
The bear flag pattern is a bearish continuation pattern. Before the pattern, there is a downtrend, and the goal is to continue the downtrend. The price slopes upwards during the flag, defined by two lines. The pattern may print minor higher highs and higher lows within the flag, but sometimes it may be more like a straight line.
Bear Flag Strategy
The most clear entry point is at the breakout (breakdown). Enter at the candle close. When the candle close happens near the support level of the flag, wait for one more candle to confirm the breakout (confirmation candle). Place the stop loss just above the highest point of the flag. Measure the impulsive move before the flag and use that distance as the target, or use a risk-to-reward ratio.
The Head and Shoulders Pattern
The head and shoulders pattern is a bearish reversal pattern. Before the pattern, there is an uptrend, and after the pattern, there is a downtrend. The pattern consists of a left shoulder, a head (higher high), and a right shoulder (lower high). Connect the two low points between the highs with a line (neckline). The pattern is stronger if the second low point is lower than the first.
Head and Shoulders Strategy
Enter when the price breaks below the neckline. Place the stop loss just above the right shoulder. Target a 2:1 risk-reward ratio. Measure from the head down to the neckline and use that distance as the target. Another entry is to wait for the neckline to flip to become resistance and then enter at a reaction from the resistance. This is more suitable for short-term traders.
The Inverse Head and Shoulders Pattern
The inverse head and shoulders pattern is a bullish reversal pattern. Before the pattern, there is a downtrend, and after the pattern, the price goes up. The pattern consists of a left shoulder, a head (lower low), and a right shoulder (higher low). The highs between these lows are also important.
Inverse Head and Shoulders Strategy
Focus on the retest of the neckline. Look for strong bullish momentum coming from the test of support. Enter at the candle close of that momentum candle. Place the stop loss below the lowest points of the retest. Use a 2:1 risk-reward ratio. Trading the breakout is also possible, but be cautious if the price quickly dips below after the breakout.
The Falling Wedge Pattern (Special)
The falling wedge pattern can act both as a reversal and as a continuation pattern. The direction is bullish. The pattern can appear after a downtrend and reverse the price to the upside, or it can appear after an uptrend and continue the price towards the upside. Look for lower highs and lower lows, but the slope of the highs should be steeper than the slope of the lows.
Falling Wedge Strategy
The most common entry is when the price breaks above the upper line, with a strong momentum candle. Enter at the candle close of the breakout. Place the stop loss below the lowest part of the wedge. Use a measured move or a risk-to-reward ratio of two. Another entry is at the support, looking for a candle that slightly dips below the support and then quickly pushes above (bullish hammer).
The Rising Wedge Pattern (Special)
The rising wedge pattern can also act both as a reversal and as a continuation. The pattern can appear after an uptrend and reverse the price, or it can appear after a downtrend and continue the price down. Look for consecutive higher highs and higher lows, but the upper line should be less steep than the lower line.
Rising Wedge Strategy
The most common entry is at the breakout. Enter at the candle close. Place the stop loss just above the high. Use a measured move or a risk-to-reward ratio. Continuation patterns are often smaller than reversal patterns.
The Symmetrical Triangle Pattern 🔴
The symmetrical triangle pattern has an uncertain direction. In most textbooks, it is classified as a continuation pattern, but it often leads to the price going sideways. Look for lower highs and higher lows, with the slope of the lines being symmetrical.
Symmetrical Triangle Strategy
Symmetrical triangles often lead to a trading range (price moving sideways). Avoid these patterns because the breakout may not be significant. Trading ranges have a resistance area and a support area, with the price moving sideways within this range.
The Broadening Range Pattern 🔴
The broadening range pattern has both an uncertain direction and an uncertain type. It is super hard to trade. Look for higher highs and lower lows, with an upward-sloping resistance line and a downward-sloping support line. This pattern indicates increased volatility.
Broadening Range Strategy
Broadening ranges often lead to the price going sideways in a range fashion. Avoid these patterns. If you want a trading strategy, try to find movements quickly above the resistance or quickly below the support and then enter at the failed breakout.
The Cup and Handle Pattern
The cup and handle pattern is typically a bullish continuation pattern, but in some cases, it can also act as a reversal. It is a very large pattern. Before the pattern, there is a trend towards the upside. The price starts to print both lower highs and lower lows, then higher lows. Within the cup and handle pattern, there is often another pattern, such as a head and shoulders. Look for a U shape (cup) and then a pullback (handle).
Cup and Handle Strategy
Enter at the break of the horizontal line. Place the stop loss below the low of the handle. Use a risk-to-reward ratio of two. Another entry is at the retest of the resistance. Enter after a strong candle. Another potential entry is to enter at the handle itself. Measure the pattern to determine your target level.
The Reverse Cup and Handle Pattern
The reverse cup and handle is the bearish version of the cup and handle. The direction is bearish, and the type is most often continuation. This pattern can often be even harder to spot than the normal cup and handle. Look for a U shape and then the handle.
Reverse Cup and Handle Strategy
Enter the reverse cup and handle as a rising wedge. Enter as the price is breaking the rising wedge. Place the stop loss just above the high. Use a 2:1 target level. Another strategy is to enter the break below support.
The Ascending Triangle Pattern
The ascending triangle pattern is a bullish continuation pattern. Before the pattern, there is an uptrend. During the pattern, there are consecutive higher lows. The highs of the pattern are around the same level.
Ascending Triangle Strategy
Enter at the break above resistance. The candle that breaks out should be strong. Place the stop loss just below the most recent low inside the triangle. Use a risk-to-reward ratio of 1:2. Another way to enter the ascending triangle is to enter at the pullback after the breakout.
The Descending Triangle Pattern
The descending triangle is a bearish continuation pattern. Before the pattern, there is a downtrend. The lows are at around the same level. The triangle should clearly be sloping down.
Descending Triangle Strategy
Enter at the break of support. Focus on the entry point after the pullback. Enter on the reaction of previous support flipping to become resistance. Place the stop loss above the resistance. Enter at the break of the pullback structure. Measure the pattern to determine the target level.
Thanks for Watching! (Do This Next)
The video concludes by thanking viewers for watching and encouraging them to like the video, share it, and leave comments with any questions. Viewers are also recommended to watch the playlist with all trading courses for further learning.

